Where I learned dashboard design.
The Vantage Circle admin dashboard — the screen program managers use to run an entire wellness program. It was a senior designer's project; I came in to help build smaller pieces of it. It's also where dashboard design finally clicked for me.
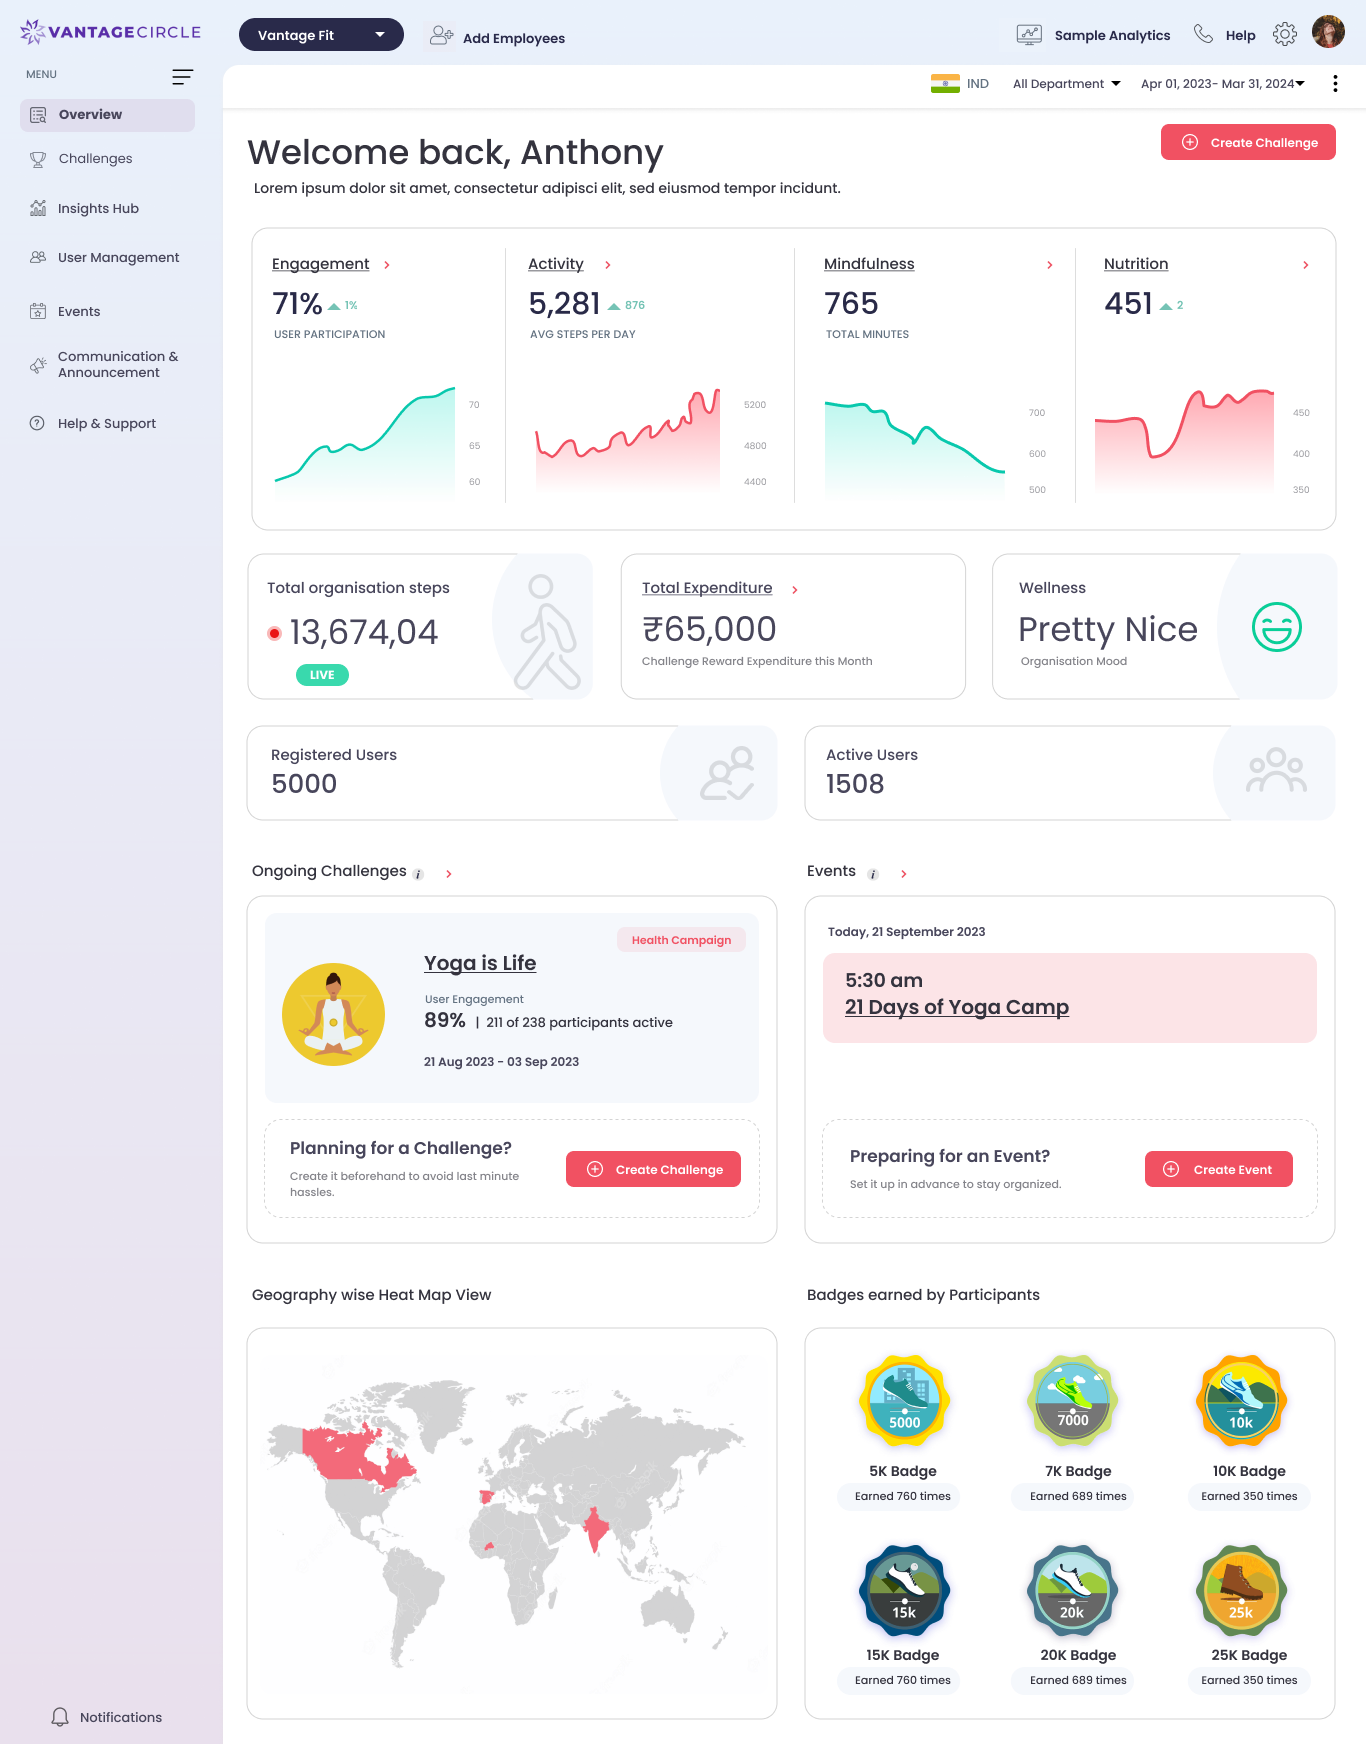
The overview screen — a program's whole picture in one view. Hover to scroll · click to zoom.
Role
UI/UX Designer — sections, components & assets
Tools
Figma
I joined
2024 — on a design first built years earlier
Status
Retired — since replaced by a new layout
01 — Overview
The control room behind the app.
Vantage Fit isn't just the employee app. There's a whole admin side where HR and program managers actually run things — track engagement, launch challenges and events, and watch steps and badges add up across the company. This dashboard is that control room.
The dashboard itself goes back years — it was first designed around when the product started, long before me. I came onto it in 2024, helping a senior designer who owned it: building smaller sections, components, and visual assets that fit the system already in place. Vantage Circle is my first job, so a lot of my real learning has happened exactly like this — on live work, next to people who'd done it before. This is the project where I learned how a dashboard actually holds together.
It's no longer the live dashboard — we've since moved to a new, vibe-coded layout (more on that in the projects that follow). But it's still the place my dashboard sense was built.
02 — What makes it hard
A lot at once, still readable.
A marketing page tells one story. An app screen has one job. A dashboard has to hold dozens of things at the same time — numbers, charts, lists, actions — and still let someone find what they need at a glance. That balance was completely new to me, and it's harder than it looks.
- Show a lot of data without it turning into noise
- Get the hierarchy right — what a manager needs first, what can wait
- Build in reusable pieces so the whole thing stays consistent
- Make charts and stats that read in a second, not a minute
“The trick with a dashboard isn't fitting everything in. It's making a crowded screen feel calm.”
03 — The analytics
Many small reads, one screen.
What made this a real dashboard was the range of things it had to show at once — and each one is its own little design problem. Trends over time, where people are active, even health readings, all sitting together without shouting over each other. A few of the modules:
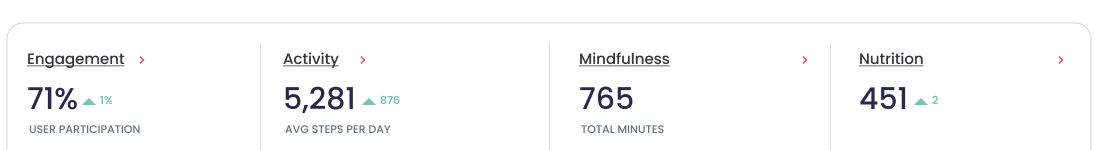
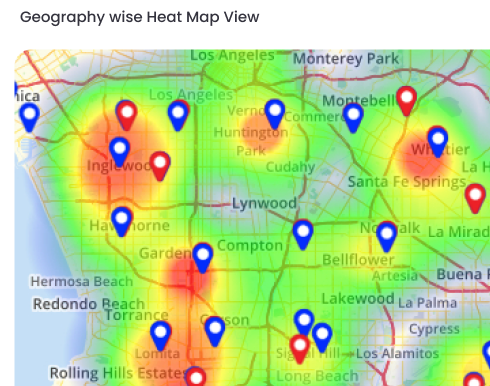
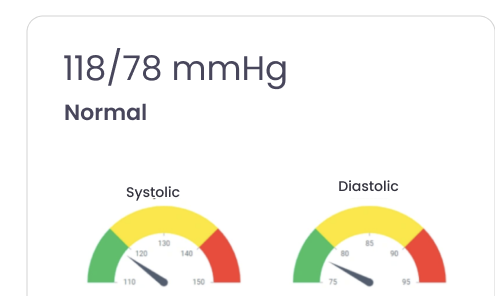
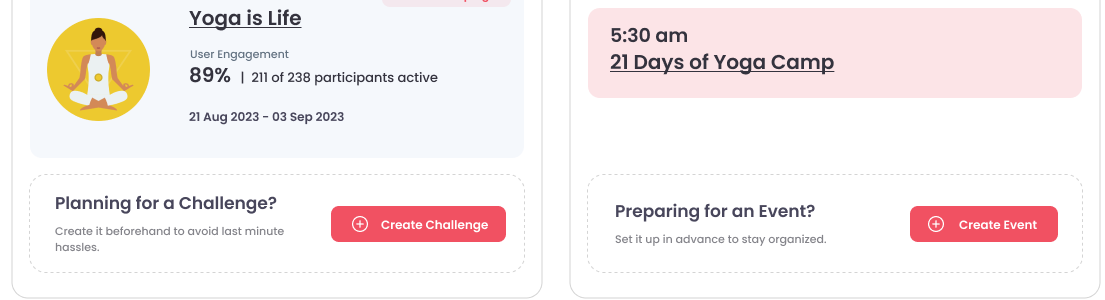
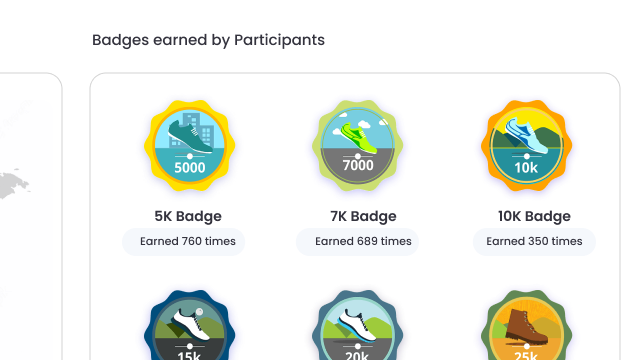
Trend cards, a geographic heat map, health readouts like blood pressure, challenge & event modules, and the illustrated badges — the kinds of analytics one overview had to hold.
04 — The wider system
It went deeper than one screen.
The overview was only the front door. Being on this product meant seeing how far a wellness dashboard really goes — engagement sliced every way a manager might ask, a workforce-health view that surfaces real risks, leagues, geography, reports. A couple of the screens that show the range:

Engagement Insights — the same number broken down by department, gender, age and location, with social and challenge activity below.
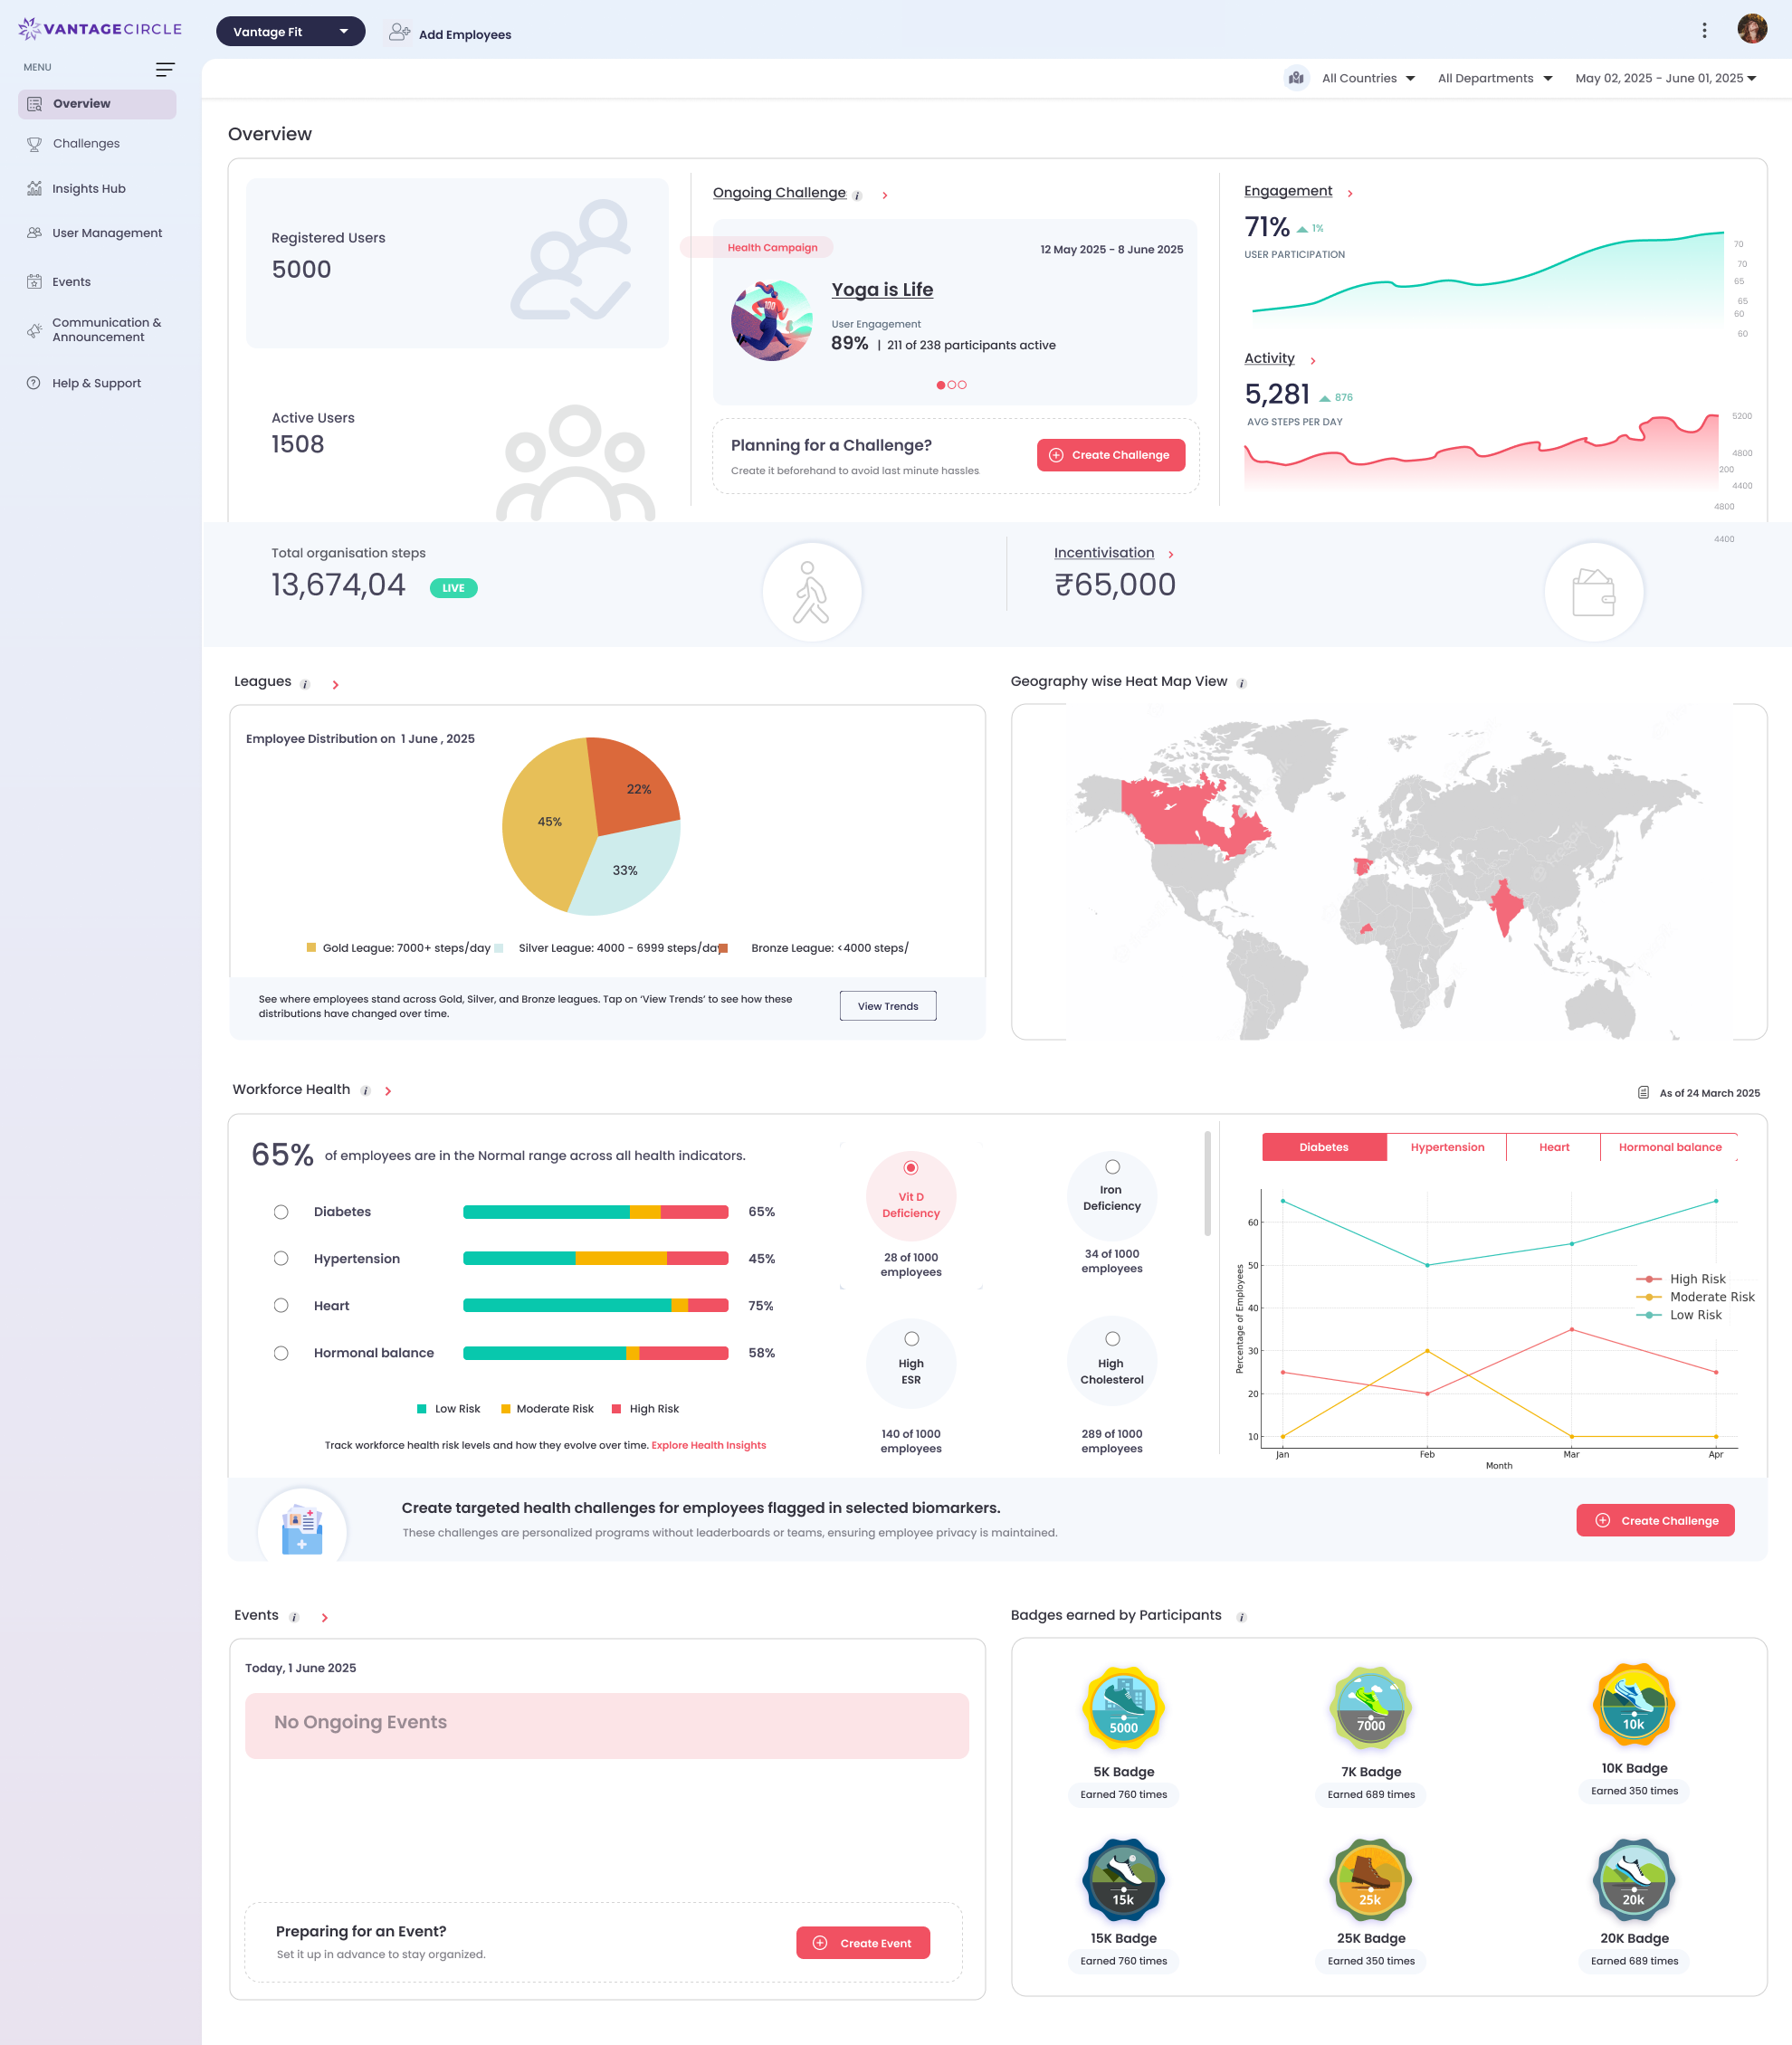
A later overview — leagues, a geographic heat map, a full workforce-health view and badges, all in one place.
05 — What I worked on
The small, hands-on stuff.
My part was the close-up work — building and refining sections, putting together reusable components, and making visual assets that matched the existing system. None of it was the headline, and that's exactly why it taught me so much. I learned the craft by sweating the details on something real, with someone reviewing my work and pushing it further.
06 — What it taught me
My grounding in dashboards.
This is the project where dashboard design stopped being abstract. I learned to think in components and hierarchy, to respect how much a single screen can carry, and how to work inside someone else's system without breaking its logic. Mostly it reminded me that my foundation is being built on the job — in real files, next to people I learn from — and that's a good place to start.